
Crypto Blog
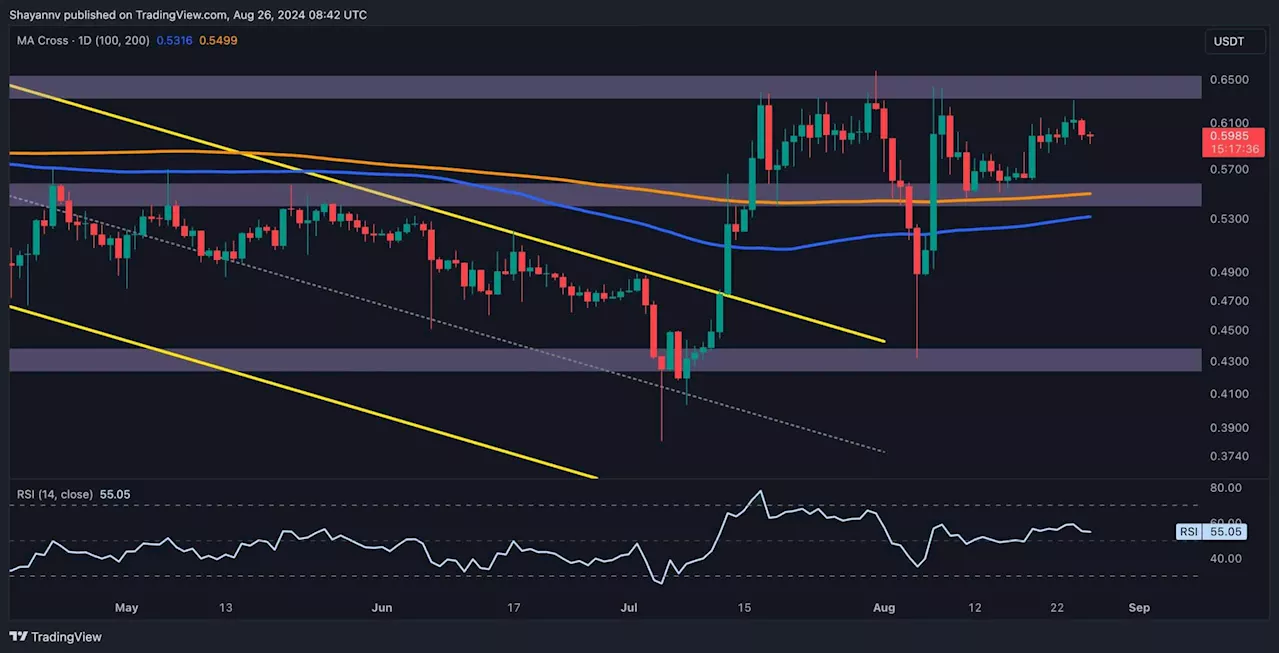
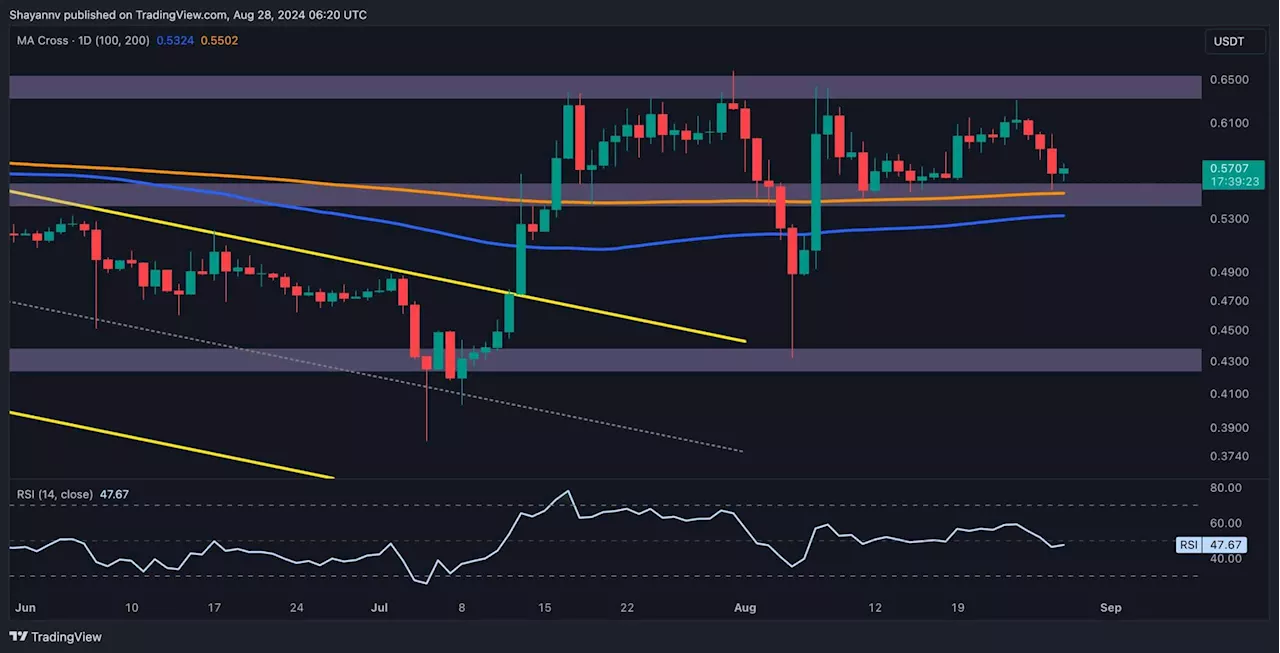
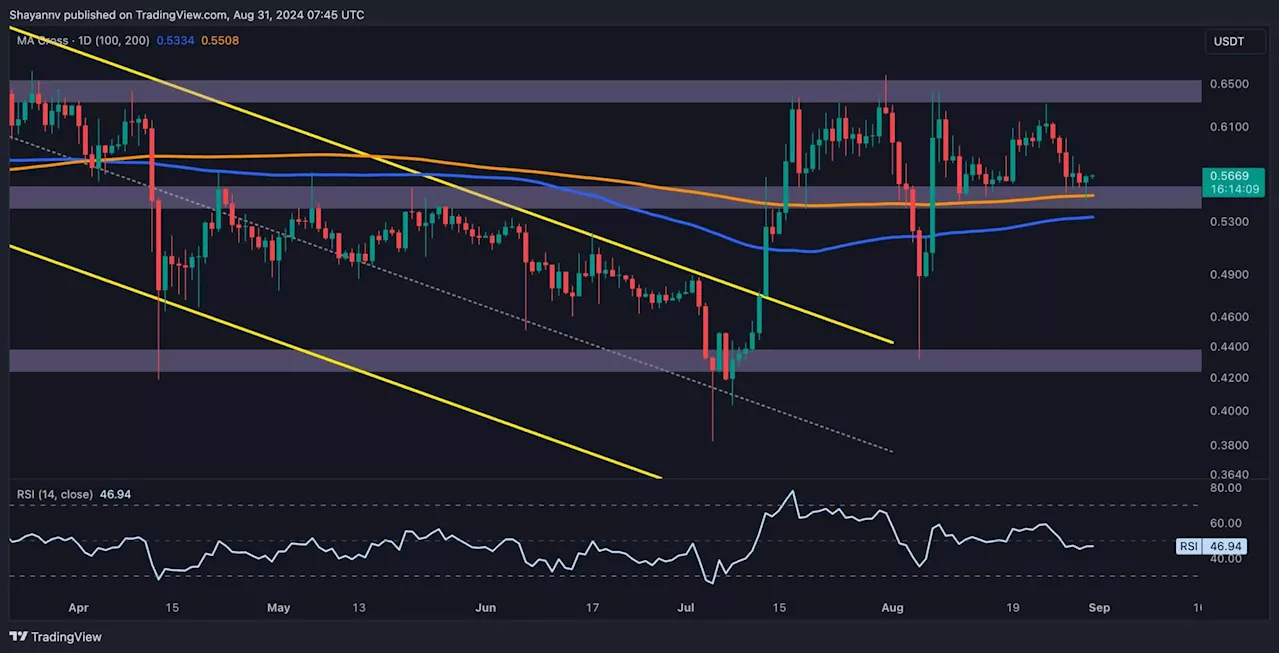
Ripple has undergone another sharp drop, breaking below the critical 100-day moving average of $0.53.
A closer look at the daily chart shows that Ripple faced significant selling pressure, leading to a break below the crucial 100-day moving average at $0.53. The breach of the 100- and 200-day moving averages indicates a strong bearish signal, affirming the dominance of sellers in the market. Ripple is retracing toward the broken MA, attempting to complete a pullback.
Simultaneously, XRP has reached a critical support zone defined by the 0.5 to 0.618 Fibonacci retracement levels, where demand may emerge and temporarily halt the decline.
Nigeria Latest News, Nigeria Headlines
Similar News:You can also read news stories similar to this one that we have collected from other news sources.
 Ripple Price Analysis: Here’s What You Need to Know About XRP’s Next MoveCrypto Blog
Read more »
 Ripple Price Analysis: XRP Bulls Want to Aim $0.64 But There’s a CatchCrypto Blog
Read more »
 Ripple Price Analysis: Is XRP on the Verge of an Imminent Correction Below $0.55?Crypto Blog
Read more »
 Ripple Price Analysis: Will The $0.55 Support Level Hold After XRP Was Rejected at $0.6?Crypto Blog
Read more »
 XRP Is Down 8% Weekly But Bullish Signs Appear (Ripple Price Analysis)Crypto Blog
Read more »
 Ripple Price Analysis: Bullish Sentiment Reaffirmed, Can XRP Climb to $0.64?Crypto Blog
Read more »